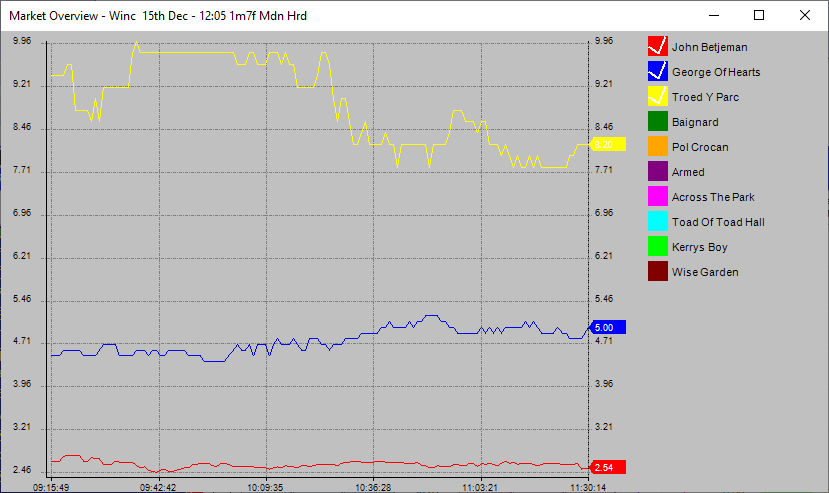
This Chart plots the last price matched over time for each selection for the current market that is open in the Grid.
Please note that there is no price history available via the API feed and so the software does not start recording the prices until you have the market open.
By default the chart shows the last 5 minutes of activity.
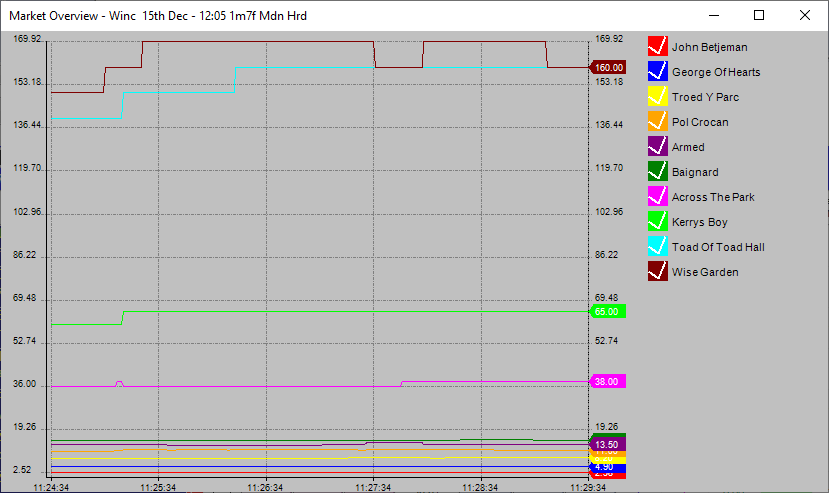
You can change the scale by right clicking on the chart.
Also you can click on the ticks next to the selection names on the right of the chart to exclude / include selections in the chart as in the image below.